Sunday, May 21, 2017

Crude Oil Trading: Weekends Post for the week 22nd May - 26th May 2017

Crude oil has a very bullish week before OPEC meeting next Thursday. There is some resistance in the daily ichimoku cloud above.

In the weekly TF, ichimoku is providing strong support to the price but it is seen flattening going forward. There is some resistance in the mid of BB too.


In the monthly TF, the mid of BB is provide good support to the price. Depending on the outcome of the opec meeting, oil could still stuck in a range for a while.

Daily support/resistance on 22nd May:50.68, 50.25
Weekly support/resistance from 22nd May - 26th: 50.38, 49.33
Monthly support/resistance for May: 50.98, 49.79 (CLM7: 49.85, 51.17, CLN7: 50.15, 51.5 )
Monthly support/resistance for Apr: 50.81, 50.73 (CLK7: 50.88, 50.93, CLM7: 51.31, 51.38)
2017 Yearly support/resistance: 49.35, 40.28

Natural Gas Trading: Weekends Post for the week 22nd May - 26th May 2017

NG has a red weekly candle and is now slightly below the neckline of the inverse HS. Price is above both weekly and daily ichimoku cloud. So price would not fall much imo after it falls through the ichimoku clouds sharply.


In the 4 hr TF, there is a shooting star. Need confirmation that price would correct. Above it could mean it is testing the ichimoku cloud above.

 In the monthly TF, price is still within the ascending channel which is good news to the bulls

Daily support/resistance on 22nd May: 3.239, 3.226
Weekly support/resistance from 22nd May - 26th: 3.285. 3.259
Monthly support/resistance for May: 3.241, 3.185  (NGM7: 3.271, 3.274 )
Monthly support/resistance for Apr: 3.125, 2.992  (NGK7: 3.143, 3.045 )
2017 Yearly support/resistance: 3.415, 2.757

Sunday, May 14, 2017

Natural Gas Trading: Weekends Post for the week 15th May - 19th May 2017

NG broke the inverse HS neckline this week. Target is the upper channel.


The possible movement is show below. There's a gap above to be filled.
 Bullish even on monthly TF. Buy on dips.
Daily support/resistance on 15th May: 3.414, 3.391
Weekly support/resistance from 15th May - 19th May: 3.286, 3.241
Monthly support/resistance for May: 3.241, 3.185  (NGM7: 3.271, 3.274 )
Monthly support/resistance for Apr: 3.125, 2.992  (NGK7: 3.143, 3.045 )
2017 Yearly support/resistance: 3.415, 2.757

Crude Oil Trading: Weekends Post for the week 15th May - 19th May 2017

Crude oil is bullish this week. We can see it is have inside bar. It is possible to have double inside bar considering opec meeting is 2 weeks from now.

Below is the possible moement. Friday is a doji. We should have a small trend this week.
 On the monthly TF, price is bouncing nicely from the mid of BB. We need end of May to confirm. Oil is bullish though! Buy on dips.


Daily support/resistance on 15th May: 47.78, 47.71
Weekly support/resistance from 15th May - 19th May: 47.51, 46.88
Monthly support/resistance for May: 50.98, 49.79 (CLM7: 49.85, 51.17, CLN7: 50.15, 51.5 )
Monthly support/resistance for Apr: 50.81, 50.73 (CLK7: 50.88, 50.93, CLM7: 51.31, 51.38)
2017 Yearly support/resistance: 49.35, 40.28

Saturday, May 6, 2017

Crude Oil Trading: Weekends Post for the week 8th May - 12th May 2017

Crude oil has an interesting move this week. It dropped all the way below 44 and then move up to 46+. A hammer is formed in the dailty TF. There are many resistance line above. It could move up to the area circled below and consolidate there before OPEC meeting.

In the monthly TF, price has bounced from the mid of BB. If it holds a big move is coming as BB has been narrowing.

From the weekly TF, you can see that price dropped about 1 month from the opec meeting last year. The same pattern seems to repeat and could be repeated in the coming weeks. If this is so, next week could be a green candle. Moreover, the price is supported by the ichimoku cloud. There is a possibility the low could be tested though.

Daily support/resistance on 8th May: 46.05, 45.22
Weekly support/resistance from 8th May - 12th May: 46.49, 46.54
Monthly support/resistance for May: 50.98, 49.79 (CLM7: 49.85, 51.17, CLN7: 50.15, 51.5 )
Monthly support/resistance for Apr: 50.81, 50.73 (CLK7: 50.88, 50.93, CLM7: 51.31, 51.38)
2017 Yearly support/resistance: 49.35, 40.28

Natural Gas Trading: Weekends Post for the week 8th May - 12th May 2017

NG has a good green weekly candle. An inverse HS seems to be forming. If this is valid, a good run up is in the making perhaps for the summer season if the weather is very very hot. There's a contract gap below. The question is will it be filled soon or after the summer season.

A possible movement could be below. Do you think if NG is setting up for a run up to 4.0?

Daily support/resistance on 8th May: 3.265, 3.233
Weekly support/resistance from 8th May - 12th May: 3.267, 3.239
Monthly support/resistance for May: 3.241, 3.185  (NGM7: 3.271, 3.274 )
Monthly support/resistance for Apr: 3.125, 2.992  (NGK7: 3.143, 3.045 )
2017 Yearly support/resistance: 3.415, 2.757

Sunday, April 30, 2017

Natural GasTrading: Weekends Post for the week 1st May - 5th May 2017

NG is back to the resistance line which is also the neckline of the inverse HS. However there is a gap below. Would it be filled before breaking the neckline?

In the monthly TF, spinning top is formed. May shall be a big move month IMO.
In the weekly TF, a bullish engulfing candle is seen. NG is bullish again. Buy on dip.


Daily support/resistance on 1st May: 3.267, 3.264
Weekly support/resistance from 1st May - 5th May: 3.233, 3.160
Monthly support/resistance for May: 3.241, 3.185  (NGM7: 3.271, 3.274 )
Monthly support/resistance for Apr: 3.125, 2.992  (NGK7: 3.143, 3.045 )
2017 Yearly support/resistance: 3.415, 2.757

Crude Oil Trading: Weekends Post for the week 1st May - 5th May 2017

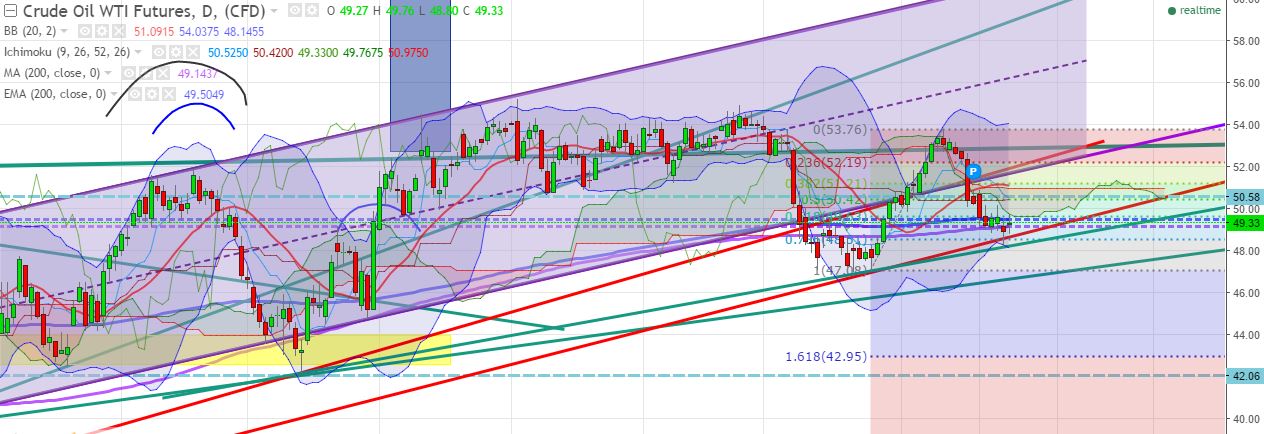
Weekly spinning top for crude oil this week. It is bouncing at those trendlines as shown below.If those holds, expect it to go above 50 again.


From the daily TF, it is hovering around the 200 MA/EMA too.

 From monthly TF, a DIB can be seen. A big move is coming in the next 1 to 2 months.

From 1hr TF, an inverse HS seems to be forming. If it is valid, expect above 50 next week.


Daily support/resistance on 1st May: 49.22, 49.28
Weekly support/resistance from 1st May - 5th May: 49.2, 49.21
Monthly support/resistance for May: 50.98, 49.79 (CLM7: 49.85, 51.17, CLN7: 50.15, 51.5 )
Monthly support/resistance for Apr: 50.81, 50.73 (CLK7: 50.88, 50.93, CLM7: 51.31, 51.38)
2017 Yearly support/resistance: 49.35, 40.28